Why Marketing Teams Are Moving Beyond Manual Reporting
Reporting marketing automation performance is the practice of automatically collecting, analyzing, and visualizing data from your marketing campaigns to measure effectiveness and ROI. Here's what you need to know:
Key Components of Automated Marketing Reports:
• Engagement metrics - Open rates, click-through rates, website traffic
• Pipeline metrics - Marketing qualified leads (MQLs), sales accepted leads, conversion rates
• ROI metrics - Revenue generated, customer acquisition cost, lifetime value
• Performance tracking - Campaign effectiveness, channel attribution, budget allocation
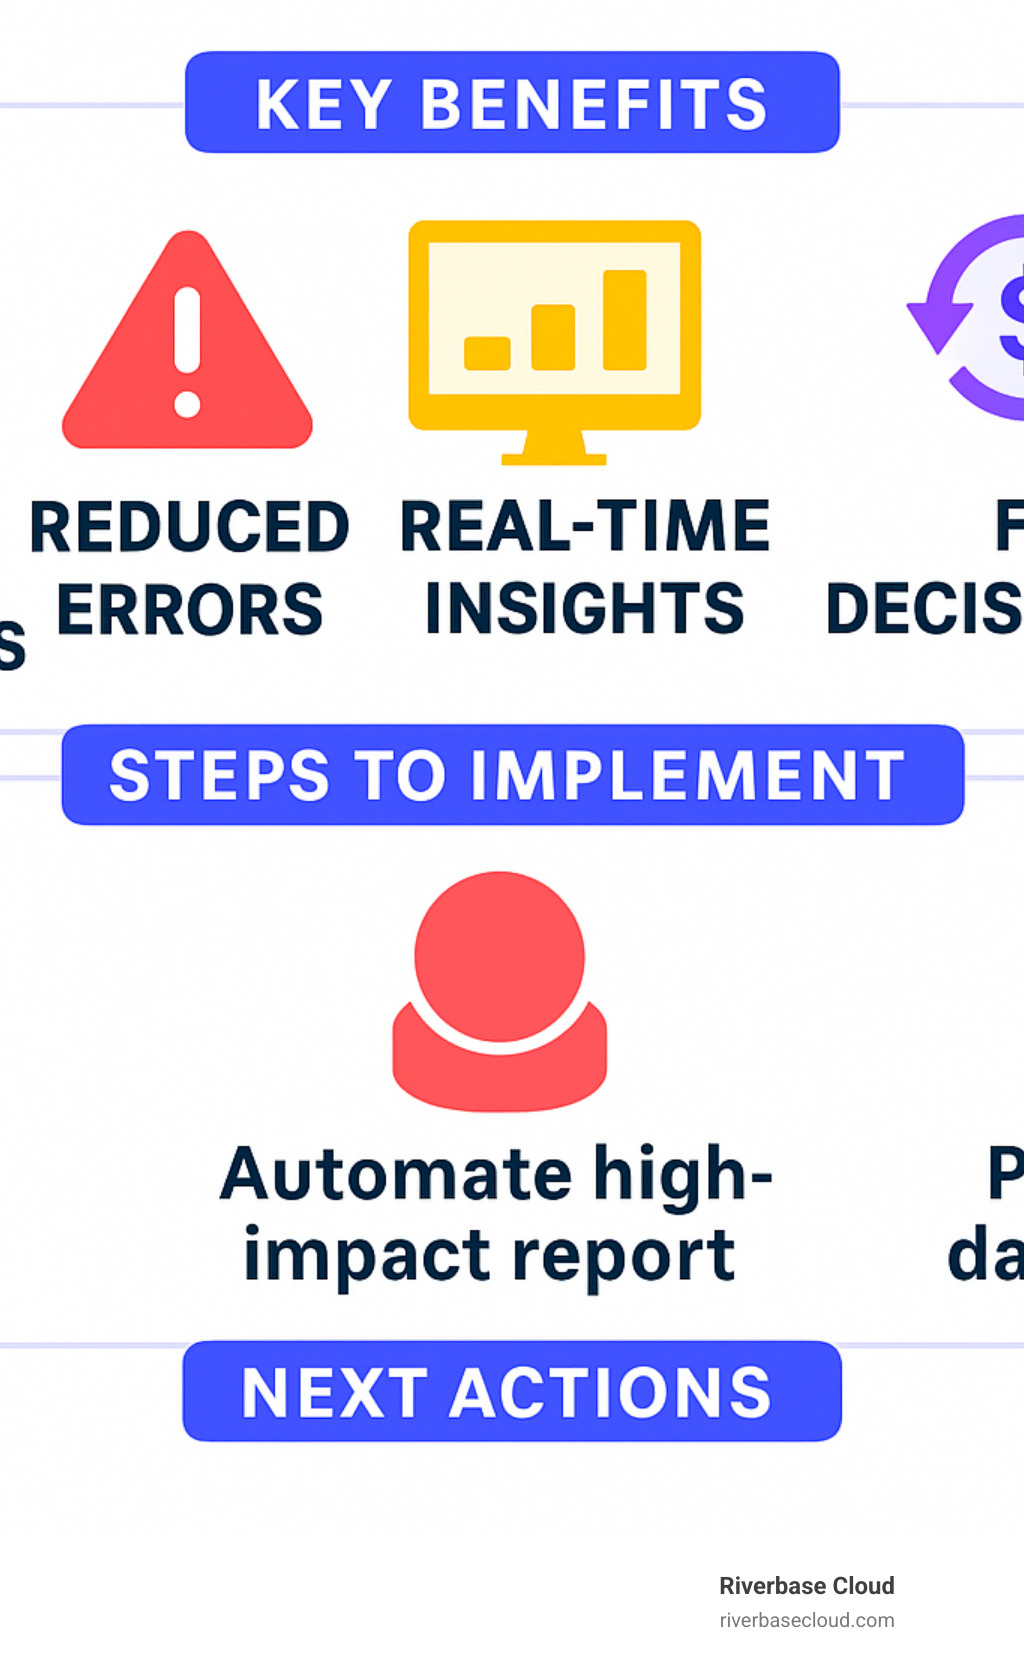
Benefits: • Saves 20%+ of work hours typically spent on manual reporting • Eliminates human errors from copy-paste data entry • Provides real-time insights for faster decision-making • Scales reporting as your marketing programs grow
Are you still stuck copying data from multiple platforms into spreadsheets every morning? You're not alone. Research shows that marketers spend over 20% of their work hours on reporting tasks - time that could be better spent on strategy and optimization.
The pressure to prove marketing's value has never been higher. 85% of marketers report increasing pressure to demonstrate their contribution to business results, yet only 25% can effectively measure and report their programs' impact. Manual reporting processes are error-prone, time-consuming, and prevent the real-time decision-making that modern marketing demands.
This is where automated reporting transforms everything. Instead of wrestling with spreadsheets, you get clean dashboards that update automatically. Instead of guessing which campaigns work, you see clear attribution paths from first touch to closed deal.
I'm Gary Gilkison, founder of Riverbase Cloud, where I've spent years helping SMBs streamline their reporting marketing automation performance through AI-powered solutions. My experience building and scaling marketing systems has shown me that the right reporting foundation is what separates growing businesses from those stuck in manual processes.
Quick reporting marketing automation performance definitions:
- AI-driven SEO tools
- AI-driven business growth
- AI marketing strategies
Why This Guide Matters
The shift from manual to automated reporting isn't just about convenience—it's about survival in today's competitive landscape. When we work with clients at Riverbase Cloud, we consistently see that businesses using automated reporting make decisions 3x faster than those stuck in spreadsheet purgatory.
Consider this: while you're spending Monday morning updating last week's performance charts, your automated competitors are already optimizing campaigns based on real-time data. That's not just an efficiency gap—it's a competitive disadvantage that compounds over time.
The 20% time savings statistic we mentioned earlier becomes even more significant when you're scaling teams. One marketing manager spending 8 hours weekly on reports might seem manageable. But when that becomes three managers spending 24 collective hours, you're looking at nearly a full-time employee's worth of work dedicated solely to data compilation.
Who Should Read
This guide is designed for several key audiences who can immediately benefit from implementing automated reporting:
Marketing managers and directors who need to prove ROI and optimize campaign performance while managing growing workloads. If you're tired of being the "spreadsheet person" instead of the strategic thinker, this guide will show you how to reclaim your time.
Marketing analysts and operations professionals who understand the technical side but need frameworks for choosing the right tools and setting up governance. We'll cover the nuts and bolts of building scalable reporting systems.
Small and medium-sized business owners who wear multiple hats and need efficient ways to track marketing performance without hiring dedicated analysts. Our approach focuses on practical, cost-effective solutions that grow with your business.
Agency professionals managing multiple client accounts who need standardized, white-labeled reporting that scales across portfolios. We'll show you how to create consistent reporting frameworks that impress clients while saving your team hours of manual work.
Understanding Automated Reporting & Why It Beats Spreadsheets
Picture this: it's Monday morning, and instead of spending three hours copying data from different platforms into spreadsheets, you're sipping coffee while reviewing insights that updated automatically over the weekend. That's the power of automated reporting, and it's built on some pretty smart technology working behind the scenes.
The magic starts with APIs (Application Programming Interfaces) - think of them as digital translators that help different software systems talk to each other. Your email platform can chat directly with your dashboard tool. Your social media scheduler shares performance data with your analytics system. Your CRM automatically updates revenue reports without you lifting a finger.
When you set up automated reporting, you're basically creating a network where all your marketing tools become best friends. They share information instantly, eliminate those dreaded copy-paste errors, and give you real-time data refresh capabilities. Instead of looking at last week's numbers, you can spot trends and catch problems while there's still time to fix them.
What Is Marketing Automation Reporting?
Marketing automation reporting goes way beyond tracking individual campaigns. It's like having a bird's-eye view of your entire marketing ecosystem, showing you how all the pieces work together to drive real business results.
Here at Riverbase Cloud, we've learned that truly effective reporting marketing automation performance needs three key ingredients to succeed.
First, you need a single source of truth where all your marketing data lives happily together. No more playing detective to figure out why your email platform shows different numbers than your social media dashboard. When your boss asks about last quarter's performance, you'll have one confident answer instead of five confusing ones.
Second, you need complete campaign visibility that follows prospects from their first "hello" to their final purchase (and beyond). This means understanding how your email sequences, social posts, and paid ads work as a team to guide people through your sales funnel.
Third, your system should be smart enough to watch for problems and opportunities automatically. Instead of finding issues weeks later during your monthly review, you'll get friendly alerts when something needs attention or when a campaign is crushing it.
Manual vs. Automated: Key Challenges & Gains
Let's talk honestly about what manual reporting really costs you. There's the obvious time drain, but the hidden problems often hurt even more.
| Aspect | Manual Reporting | Automated Reporting |
|---|---|---|
| Time Investment | 8-20 hours per week | 2-4 hours per week (setup + review) |
| Error Rate | High (copy-paste mistakes, formula errors) | Minimal (data validation built-in) |
| Data Freshness | Weekly or monthly snapshots | Real-time or hourly updates |
| Scalability | Linear increase in time with more campaigns | Scales automatically |
| Consistency | Varies by person and mood | Standardized formats and calculations |
| Decision Speed | Days to weeks for insights | Minutes to hours |
| Cost | Hidden cost of employee time | Transparent tool costs |
Human errors are the silent killer of good marketing decisions. Even careful people make mistakes when copying data, and research shows manual data entry has error rates between 1-5%. That might sound small, but we've watched clients make costly budget decisions based on wrong numbers from simple spreadsheet mistakes.
The refresh frequency advantage changes everything about how quickly you can respond to opportunities. With manual reporting, you're always looking backward at old data. By the time you spot a problem, you've already lost days or weeks of potential fixes. Automated systems can ping you within hours when campaigns underperform or when something unexpected starts working really well.
Cost savings become obvious once you calculate the real price of manual work. If a marketing manager spends 10 hours weekly on reports at $30 per hour, that's $15,600 annually just for data compilation. Automated tools typically cost a fraction of that while delivering much better results.
Four Core Report Types
Effective reporting marketing automation performance covers four essential areas that paint the complete picture of your marketing success.
Email marketing reports track how your automated sequences, newsletters, and triggered campaigns perform. You'll see delivery rates, open rates, click-through rates, unsubscribe patterns, and most importantly, how much revenue each email generates. These reports help you understand which messages connect with your audience and where you can optimize your sequences for better results.
Social media automation reports monitor your scheduled content, engagement rates, follower growth, and how social interactions feed into your broader marketing funnel. This is especially valuable for understanding which social content drives the most qualified visitors to your website and how those visitors behave once they arrive.
Marketing attribution reports solve the puzzle of which touchpoints actually drive conversions. These reports answer the big questions like "Which combination of email, social, and paid ads works best?" and "What does a typical customer journey look like from first visit to final purchase?" They're complex but incredibly valuable for understanding true ROI.
Cross-channel revenue reports tie everything together by showing how your integrated marketing efforts drive actual business outcomes. You'll track customer acquisition costs, lifetime value, and revenue per campaign across all channels simultaneously, giving you the complete financial picture of your marketing performance.
Reporting Marketing Automation Performance: Metrics & KPIs That Matter
Here's the truth about reporting marketing automation performance: most businesses track way too many metrics and not enough of the right ones. After years of helping SMBs optimize their marketing at Riverbase Cloud, I've seen teams drown in data while missing the signals that actually matter for growth.
The secret isn't collecting every possible data point—it's focusing on metrics that tell a complete story about your customer journey. When we audit client dashboards, we typically find they're tracking 30+ metrics but can't answer basic questions like "Which automation sequence drives our best customers?" or "Are we spending too much to acquire leads that never convert?"
The most successful businesses organize their metrics into four focused categories. Each category serves a specific purpose, and together they create a complete picture of your automation performance. Think of it like checking your car's dashboard—you need oil pressure, speed, fuel level, and engine temperature, but you don't need to monitor every sensor under the hood.
Engagement Metrics (Opens, CTR, Time-on-Page)
Engagement metrics are your early warning system. They tell you if people actually want to hear from you before you even get to the conversion stage. These numbers can save you from costly mistakes or help you double down on what's working.
Email open rates might seem less reliable since Apple's privacy updates, but they're still incredibly valuable for spotting trends. Don't obsess over hitting exactly 25% open rates—instead, watch for sudden drops or unexpected spikes. If your open rates suddenly tank, you might have a deliverability problem or your subject lines might have gotten stale.
Click-through rates are where engagement becomes real interest. A 3% CTR might sound low, but if those clicks convert well, that's golden. The magic happens when you segment your CTR data. Your VIP customers might click at 8% while new subscribers hover around 2%—and that's perfectly normal.
We always tell clients to run A/B testing continuously, not just when they remember to. Small improvements in subject lines and call-to-action buttons compound over time. One client increased their overall CTR by 40% just by testing different CTA button colors and text over six months.
Time on page and bounce rates from your automated traffic sources reveal whether your emails and social posts are attracting the right people. High email CTR but terrible website engagement usually means your email promises something your landing page doesn't deliver. It's like inviting someone to a pizza party and serving salad.
Watch your unsubscribe rates like a hawk—they should stay under 1%. Higher rates often mean you're either emailing too frequently or sending irrelevant content. We've seen businesses cut their unsubscribe rates in half just by improving their audience segmentation.
Pipeline Metrics (MQL, SQL, Sales-Cycle)
Pipeline metrics connect your marketing activity to actual business opportunities. These numbers help you understand whether your automation is generating real prospects or just keeping people busy.
Marketing Qualified Leads (MQLs) from your automation sequences represent people who've shown genuine buying interest through multiple touchpoints. The key insight isn't just counting MQLs—it's understanding which automation paths create the highest-quality prospects. Your welcome series might generate volume, but your product education sequence might generate better leads.
Sales Qualified Leads (SQLs) reveal the quality of your automation-generated prospects. If your automation creates lots of MQLs but your sales team accepts very few, you've got a lead scoring problem or a messaging alignment issue. The best companies see about 25-30% of their MQLs convert to SQLs.
Sales cycle length often improves with good automation because prospects arrive at sales conversations already educated about your solution. Track how automation-influenced deals compare to cold prospects. Many businesses see 20-30% shorter sales cycles when prospects go through proper nurture sequences.
The real magic happens when you track lead scoring accuracy by analyzing which scored leads actually become customers. If your "hot" leads convert at the same rate as "warm" leads, your scoring model needs work.
ROI Metrics (Revenue, ROAS, LTV:CAC)
ROI metrics are where reporting marketing automation performance gets serious about business impact. These numbers determine whether your automation investment pays off or just creates expensive busy work.
Revenue attribution from automation can be tricky to track but provides the clearest picture of actual value. The average marketing automation ROI is almost $6 for every dollar spent, but this varies wildly based on how well you implement and measure your systems.
Customer Acquisition Cost (CAC) should decrease as your automation gets smarter at nurturing prospects. Track CAC by automation sequence to identify your most cost-effective paths to conversion. One sequence might cost $200 per customer while another costs $50—guess which one deserves more investment?
The Customer Lifetime Value to CAC ratio (LTV:CAC) is the ultimate sustainability metric. Healthy ratios typically range from 3:1 to 5:1, meaning each customer generates three to five times their acquisition cost. Automation should improve this ratio by reducing acquisition costs and increasing customer retention through better onboarding and nurturing.
Conversion rate lift measures how much automation improves your baseline performance. Compare prospects who go through automated sequences versus those who don't. Many companies see 10-15% conversion rate improvements from well-designed automation—that's like getting a 15% raise on all your marketing efforts.
Revenue per email helps you understand the incremental value of each automated touchpoint. This metric is particularly useful for optimizing sequence length and frequency. If your fifth email in a sequence generates significantly more revenue than your fourth, maybe you need to speed up your timing.
Health Metrics (Data Quality, List Hygiene)
Data quality metrics might not be as exciting as revenue numbers, but they're the foundation that makes everything else possible. Bad data leads to bad automation, which leads to bad business outcomes—and often embarrassing customer experiences.
Data completeness rates measure what percentage of your contacts have the essential information needed for effective automation. Incomplete data means generic messaging and missed personalization opportunities. Aim for 80% completeness on your core data fields like industry, company size, or purchase history.
Duplicate detection becomes critical as your automation scales. Duplicate contacts don't just mess up your metrics—they create awful customer experiences when people receive multiple versions of the same sequence. Nothing says "we don't pay attention" like sending someone three welcome emails.
Bot filtering ensures your engagement metrics reflect real human behavior. With increasing bot traffic, you need to filter out non-human interactions from your calculations. Most advanced automation platforms include built-in bot detection, but always verify your numbers make sense.
List hygiene metrics like bounce rates and spam complaints directly impact your sender reputation. Poor list hygiene doesn't just hurt current campaigns—it can damage your ability to reach inboxes for months or years. Monitor these metrics weekly, not monthly.
Data freshness matters more than most people realize. Stale data leads to irrelevant messaging and missed opportunities. Set up alerts when key data sources haven't updated within expected timeframes. Your automation is only as good as the data that feeds it.
Building an Automated Reporting Workflow
Building an automated reporting system feels overwhelming at first. Trust me, I've been there. You're staring at a dozen different platforms, each with its own data export format, wondering how you'll ever make sense of it all. But here's the good news: reporting marketing automation performance becomes much simpler when you follow a proven step-by-step approach.
At Riverbase Cloud, we've walked hundreds of clients through this exact process. The biggest mistake we see? Companies rushing straight to the fancy dashboard creation without doing the groundwork first. It's like trying to build a house without a foundation—you'll get something that looks nice initially, but it'll crumble when you need it most.
The secret is treating your automated reporting workflow like any other important business system. You need planning, proper setup, and ongoing maintenance. But unlike other business systems, once you get this right, it actually saves you time instead of creating more work.
Step 1: Map Data Sources & Set Governance
Before you connect a single tool, grab a coffee and make a list. You need to know exactly where your marketing data lives right now. This includes your CRM system, email marketing platform, social media management tools, advertising accounts, website analytics, and any other specialized tools like webinar platforms or landing page builders.
Here's where most people go wrong: they try to connect everything at once. Don't do that. Start with what matters most for your business decisions. Your CRM data and primary email platform should be first priority because they directly impact revenue attribution. That fancy social media analytics tool? It can wait until next month.
Naming conventions might sound boring, but they'll save your sanity later. Decide right now whether you'll name campaigns "EmailNewsletter2024-01" or "email-newsletter-jan-2024" and stick with it everywhere. When you're looking at reports six months from now, you'll thank yourself for this consistency.
Think about data governance like setting house rules before roommates move in. Who gets to modify data sources? How long do you keep historical information? What happens when team members leave? These policies become critical as your automated systems handle more sensitive business data. Top automation tools work best when they have clear governance frameworks.
The integration mapping step reveals how your data actually flows between systems. Does your CRM talk to your email platform? When someone fills out a website form, how does that get attributed to the right campaign? Map these connections before you automate anything—you'd be surprised how many "obvious" connections don't actually exist.
Step 2: Choose the Right Tool Stack
Tool selection feels like dating—everyone looks great until you actually try to live with them. The key is balancing functionality with ease of use, while keeping an eye on your budget and technical comfort level.
Business intelligence tools like Tableau and Power BI are incredibly powerful, but they're like sports cars—amazing if you know how to drive them, dangerous if you don't. They're perfect for companies with dedicated analysts but often overkill for smaller teams who just want clear insights without a computer science degree.
Marketing-specific platforms like Improvado, DashThis, and Whatagraph hit the sweet spot for most businesses. They come with pre-built connectors for popular marketing platforms and templates for common report types. It's like buying a house that's already furnished—you can move in and start getting value immediately.
If you're already using an all-in-one platform like HubSpot or Marketo, check their built-in reporting first. You might already have everything you need without buying additional tools. Sometimes the best solution is the one you're already paying for.
Custom-built solutions sound appealing until you realize you're now in the software development business. The hidden costs of maintenance, updates, and training often make pre-built solutions more cost-effective in the long run.
When evaluating tools, focus on practical questions: How many of your existing platforms have native integrations? How long will setup take? Can your team actually use this without extensive training? What's the total cost including support and training?
Step 3: Configure Refresh, Schedules & Smart Alerts
Data refresh frequency should match how you actually make decisions. If you only review performance weekly, hourly updates are just wasting system resources. But if you're actively optimizing campaigns, real-time data becomes essential.
For most businesses, we recommend email campaign data refreshing every 4-6 hours during active campaigns, website analytics updating daily for most metrics, advertising data refreshing every 2-4 hours for active campaigns, and CRM data updating in real-time for new leads but daily for historical information.
Smart alerts transform your reporting from passive to proactive. Instead of constantly checking dashboards like a nervous parent, you get notified when something actually needs your attention. Set up alerts for performance threshold breaches (like CTR dropping below 2%), unusual activity patterns (traffic spikes or conversion rate changes), system health issues (data sources not updating), and opportunity indicators (high-performing campaigns ready for scaling).
Different team members need different information at different frequencies. Your CEO probably wants weekly summaries, while campaign managers need daily updates. Create different alert profiles instead of flooding everyone with the same notifications—your team will actually pay attention to alerts when they're relevant.
Step 4: Visualize & Annotate for Stakeholders
Creating effective visualizations is like telling a good story—you need to know your audience and what action you want them to take. The goal isn't winning design awards; it's helping people make better decisions faster.
Chart selection should feel intuitive. Trend lines work great for showing performance over time, bar charts excel at comparing different campaigns or channels, and pie charts show proportional breakdowns (though use these sparingly—they're harder to read than most people think). If your stakeholders need training to understand your charts, they're too complex.
Context and annotation separate good dashboards from great ones. Add notes explaining unusual spikes or dips, include benchmark indicators showing whether performance is above or below expectations, and show goal progress so people understand how current performance relates to targets.
White-label customization becomes important when sharing reports with clients or external stakeholders. Consistent branding, professional formatting, and custom domains improve credibility and reinforce your expertise.
Benchmarking integration helps everyone understand whether "good" numbers are actually good. Include industry benchmarks, historical comparisons, and goal progress indicators. Context turns confusing numbers into actionable insights, which is exactly what effective reporting marketing automation performance should deliver.
Turning Reports into Actionable Insights
Here's the truth about reporting marketing automation performance: having beautiful dashboards means nothing if they don't change how you make decisions. I've watched countless businesses get excited about their shiny new reporting systems, only to realize weeks later that they're still making the same gut-based choices they made before.
The difference between companies that succeed with automation reporting and those that struggle isn't the sophistication of their tools—it's how systematically they turn data into action. At Riverbase Cloud, our most successful clients treat their reports as conversation starters, not conversation enders.
Data Storytelling for Faster Decisions
Your stakeholders don't want to become data analysts. They want answers to specific questions: "Should we increase our email frequency?" "Which campaigns deserve more budget?" "Are we on track to hit our quarterly goals?"
This is where data storytelling transforms your reporting from a chore into a strategic advantage. Instead of presenting seventeen different metrics, focus on the three insights that matter most this week. Maybe your automation sequences are generating 40% more qualified leads than last quarter, but those leads are taking 20% longer to convert. That's a story worth telling—and acting on.
Context becomes everything when you're trying to drive decisions. A 15% drop in email open rates sounds alarming until you realize it happened during the week everyone was at the industry's biggest conference. A sudden spike in cost-per-lead might be concerning unless you know it coincides with expanding into a more valuable market segment.
The best approach we've found is the "So what? Now what?" framework. For every metric you present, answer two questions: Why does this matter to our business goals? What specific action should we take based on this information? This approach turns passive reporting into active business intelligence.
Executive summaries should feel like having a conversation with a trusted advisor, not reading a technical manual. Start with the bottom line: "Our automation is working—we're generating 23% more qualified leads this month and they're converting at higher rates. Here's what's driving that success and how we can accelerate it."
Continuous Improvement Loop
The most powerful aspect of automated reporting isn't the automation itself—it's how it enables rapid experimentation and learning. When you can see results within hours instead of weeks, you can test ideas faster, fail cheaper, and scale successes more confidently.
The test-learn-scale approach treats every change as a hypothesis worth testing. Your reports show that engagement drops after the third email in your welcome sequence? Test a shorter sequence with half your new subscribers and measure the difference. See a 15% improvement in conversions? Roll it out to everyone and look for the next optimization opportunity.
This is where AI-powered insights really shine. Modern reporting tools can spot patterns you'd never notice manually—like how prospects who engage with video content in your automation sequences convert 30% faster, or how leads from certain geographic regions respond better to different messaging approaches.
Predictive analytics takes this even further by helping you anticipate problems before they impact results. Instead of finding that your email deliverability dropped last week, you get alerts when engagement patterns suggest deliverability issues might be developing. Instead of realizing too late that a campaign isn't hitting its targets, you get early warnings when performance trends suggest you need to adjust course.
The key is building SMART goals directly into your reporting dashboard. Every metric should clearly show whether you're on track to hit specific, measurable targets. This alignment keeps everyone focused on outcomes that actually matter to your business.
Security & Compliance Considerations
As your reporting marketing automation performance system becomes more central to your business operations, protecting that data becomes critical. This isn't just about preventing hackers—it's about maintaining customer trust and meeting regulatory requirements that seem to get more complex every year.
Data encryption and access controls should be table stakes, not optional features. Look for reporting platforms that offer SOC 2 Type II compliance and understand exactly where your data is stored and how it's protected. This becomes especially important if you're handling customer data subject to GDPR or CCPA requirements.
Permission management gets tricky as your team grows. Your sales manager needs to see lead quality metrics but probably shouldn't access detailed cost data. Your executives want ROI summaries but don't need to see every operational detail. Smart permission structures ensure people see what they need without overwhelming them—or exposing sensitive information unnecessarily.
Audit trails might seem like overkill until you need them. When someone asks who changed a campaign setting or accessed customer data, you'll be grateful for detailed logs. Many businesses also find that audit capabilities help with compliance reporting and security assessments.
The bottom line is that security shouldn't be an afterthought when you're building reporting systems that handle increasingly sensitive business and customer data. A little planning upfront prevents major headaches down the road.
Frequently Asked Questions about Automated Marketing Reports
Let's address the most common questions we hear from businesses making the transition to automated reporting marketing automation performance. These are real concerns from real companies, and the answers can help you avoid common pitfalls while building confidence in your reporting strategy.
How do I pick KPIs for my automation workflows?
The secret to choosing the right KPIs is working backward from your business goals rather than forward from available data. It sounds simple, but most companies get this wrong by tracking metrics just because they're easy to measure.
Start by asking yourself: what decisions do I need to make each week? If you're primarily focused on lead generation, your core metrics should revolve around MQL volume, lead quality scores, and cost per lead. If customer retention drives your business, focus on engagement progression, lifecycle advancement, and churn warning indicators.
Here's the golden rule: limit yourself to 5-7 core KPIs per automation workflow. More than that and you'll suffer from analysis paralysis. Each metric should directly connect to an action you can take. For example, tracking email open rates only makes sense if you're prepared to adjust subject lines, send times, or sender names based on the results.
Consider your organizational hierarchy when selecting KPIs. Your day-to-day marketers need tactical metrics like click-through rates and conversion percentages that help them optimize campaigns. Your executives care about revenue attribution and ROI numbers that justify budget decisions. Design your KPI selection to match the audience—don't overwhelm executives with operational details or leave marketers without actionable data.
The most successful approach we see is starting with three primary KPIs that directly impact revenue, then adding supporting metrics that help explain performance variations. This keeps everyone focused on what matters most while providing enough detail for optimization.
What's the first step to move from spreadsheets to dashboards?
Before you touch any reporting tools, conduct an honest audit of your current manual processes. We often find that companies are tracking metrics out of habit rather than necessity—legacy reports that nobody actually uses for decisions but everyone feels obligated to maintain.
Ask yourself: which reports do you actually look forward to receiving? Which ones change your behavior or influence your strategy? These are the reports worth automating first. The ones that sit unopened in your inbox can probably be eliminated entirely.
Start with your biggest pain point, not your most complex report. Choose the report that takes the most manual effort to create or the one that's most critical for weekly decision-making. Maybe it's your campaign performance summary that requires copying data from five different platforms. Maybe it's your lead quality report that involves cross-referencing CRM data with email engagement metrics.
Success with one automated report builds confidence and provides a template for expanding your system. You'll learn the quirks of your data sources, understand the tool capabilities, and develop processes for handling exceptions. This foundation makes subsequent automation projects much smoother.
Focus on data accuracy before dashboard beauty. It's far better to have simple charts with reliable numbers than gorgeous visualizations with questionable data. Establish solid data connections, implement validation checks, and verify your automated numbers against manual calculations before investing in advanced dashboard features.
Moving from spreadsheets to dashboards is a process, not a project. Plan for a gradual transition that gives your team time to adapt and builds trust in the automated systems.
How often should automated reports refresh?
The right refresh frequency matches your optimization cycle, not your anxiety level about having the latest data. This is one of the most over-engineered aspects of reporting systems—companies often default to real-time updates when daily or even weekly refreshes would serve their needs better.
Consider what you can realistically act on. If you're running email campaigns that you can adjust daily, then daily data updates make perfect sense. If you're tracking monthly performance trends for quarterly planning, weekly refreshes are probably sufficient. Hourly updates are only valuable if you're actively monitoring and optimizing campaigns throughout the day.
Think about the trade-offs between data freshness and system performance. More frequent updates consume API calls faster, can slow down dashboard loading times, and might exceed rate limits on platforms like Facebook or Google Analytics. Most businesses find that 4-6 hour refresh cycles provide an excellent balance between timeliness and system stability.
Build flexibility into your refresh strategy for different scenarios. You might want hourly updates during active campaign launches when you're watching performance and making rapid adjustments. During steady-state operations, daily updates often provide all the insight you need without taxing your systems.
Consider your team's work patterns too. If your marketing team reviews performance first thing Monday morning, make sure your dashboards refresh overnight Sunday. If you have weekly strategy meetings on Wednesday afternoons, ensure data is fresh by Wednesday morning. Align your refresh schedule with your decision-making schedule for maximum impact.
The goal is having current enough data to make confident decisions, not having the absolute latest numbers just because you can. Focus on consistency and reliability over real-time updates, and you'll build more trust in your reporting marketing automation performance systems.
Conclusion
The journey from spreadsheet chaos to automated reporting marketing automation performance isn't just about making your Monday mornings less stressful (though that's a nice bonus). It's about fundamentally changing how your business competes in today's fast-moving marketplace.
Think about it this way: while you're manually updating last week's numbers, your competitors with automated systems are already tweaking this week's campaigns based on real-time data. That's not just an efficiency gap—it's a strategic disadvantage that compounds over time.
We've seen this change hundreds of times at Riverbase Cloud. Clients come to us drowning in spreadsheets and leave with crystal-clear dashboards that actually help them make better decisions. The 20% time savings is just the beginning. The real magic happens when teams can spot opportunities faster, catch problems earlier, and optimize campaigns while they're still running.
The businesses that thrive aren't necessarily the ones with the biggest budgets or the fanciest tools. They're the ones that can turn data into decisions quickly and accurately. When your email campaign starts underperforming, you know within hours instead of weeks. When a particular automation sequence shows promise, you can scale it immediately rather than waiting for the monthly review.
Our Managed-AI solutions take this concept even further. Whether it's our Managed-AI ADS optimizing PPC performance across Google, Bing, YouTube, and LinkedIn, or our Managed-AI CONTENT driving SEO results through data-driven strategies, everything starts with robust automated reporting. You can't optimize what you can't measure accurately.
The principles we've covered—focusing on metrics that actually matter, building solid data foundations, choosing tools that play well together, and creating reports that tell clear stories—work for businesses of every size. A three-person startup and a 300-person company might use different tools, but they need the same strategic approach to reporting.
Your next move should be simple: pick one reporting pain point that's driving you crazy and fix it. Maybe it's the weekly email performance report that takes three hours to compile. Maybe it's trying to figure out which campaigns actually drive sales. Start there, prove the value to yourself and your team, then expand from that foundation.
This isn't about perfection—it's about progress. The best reporting system is the one you'll actually use consistently. Start with something simple that works reliably, then add sophistication as your needs grow and your confidence builds.
If you're ready to stop being the "spreadsheet person" and start being the strategic thinker your business needs, we're here to help. Our Dashboard Analytics solutions combine smart automation with human expertise to ensure your reports are both accurate and actionable.
The future belongs to businesses that can move fast based on good information. With automated reporting marketing automation performance, your business can be one of them. And honestly, your Monday mornings will be a lot more pleasant too.